Director
Support House’s Centre for Innovation in Peer Support
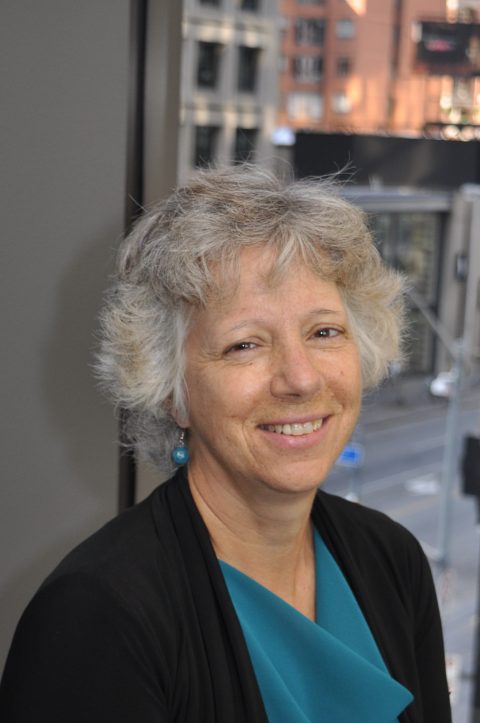
Betty-Lou Kristy is the Director of Support House’s Centre for Innovation in Peer Support. Support House’s Centre for Innovation in Peer Support provides wellness based, peer-led self-help and social connections programming to community members; and support to organizations who have peer staff, through training in peer-support program implementation, capacity-building, evaluation, research, knowledge brokerage, and quality improvement. As a result, the Centre has evolved to become a “Benchmark of Excellence” in peer support and the meaningful engagement of lived/living experience and family/caregiver co-design. The Centre has been awarded the 2017 Ontario Peer Development Initiative (OPDI) Innovators Award, 2017 AMHO President Shield Award and the 2016 Association of General Hospital Psychiatric Services (AGHPS) Celebrating Innovation Award.
Betty-Lou is a bereaved mother, in recovery for almost 20 years from alcohol/multi-drug addictions, trauma and mental health issues. Betty-Lou lost Pete, her 25-year-old son with concurrent disorders to an accidental opioid overdose in 2001. She has additional caregiver experience in supporting close family members with cancer, cardio, lung/COPD, diabetes and asthma. She has spent 15+ years as a provincial system-level, lived experience and family – advisor, educator, and advocate – helping to frame policy, governance, and programming. Previous to this journey her background was in corporate marketing.
Betty-Lou has over 15 years of extensive board governance training and experience. She has completed 3-6 year terms being a board director for Bereaved Families of Ontario Halton-Peel, Canadian Mental Health Association Halton (CMHA-HRB), Halton Alcohol Drug and Gambling Assessment Prevention and Treatment Services (ADAPT), Glen Mills Co-operative Housing Corporation, and Addictions & Mental Health Ontario (AMHO).
Betty-Lou is the recipient of several awards such as the 2009 Centre for Addiction and Mental Health (CAMH) Transforming Lives Award, the 2012/13 Ministry of Health and Long-Term Care Achievement, Commitment and Excellence (ACE) Award –Partner Relations for her work with the Ministers Expert Advisory Group Narcotics, and the 2016 Support House Employee of the Year Award. She was recently appointed as Chair of the Health Minister’s Patient & Family Advisory Council (M-PFAC).
Humanizing, quality of life and reduction of harm are integral to her.